Module Basics Sheet Music Analysis with CAMAT
This page contains introductory information about the module Basics Score Analysis with CAMAT: its installation, basic for working with CAMAT (Computer-aided Music Analysis Tool) and the Jupyter Notebooks (Part 1) as well as simple statistical queries (Part 2).
After the basics modules you can turn to the tutorials of the module Advanced Noten (corpus statistics and searching for interval sequences.
| Note: Currently a beta version of CAMAT is available. It is planned are to add more features as part of a follow-up project. |
Program code: Christon-Ragavan Nadar, Egor Polyakov.
English-language documentation on the structure of CAMAT and the data structure of pandas dataframe can be found at GitHub.
Download from CAMAT
A prerequisite for running the notebooks in the browser is the installation of Anaconda or Miniconda and the MuseScore score editor. Detailed installation instructions and introductory tutorials can be found here:
- Installation Jupyter Notebook, Anaconda and Miniconda
- Installation MuseScore
Then, download the zip file CAMAT_beta.zip (don't forget the current YML!) (right click → save target as) and unzip it to the folder where you installed Anaconda or Miniconda (usually 'c:/users/ name /music_xml_parser/').
Inside the folder 'music_xml_parser' there are three subfolders:
1. core contains all program-relevant python scripts. Please do not modify!!
2. data contains the folders
- xmls_to_parse contains all xml-files which are ready to directly (i.e. without further path specification) be loaded into the Jupyter notebooks. You can put your xml files into this folder. Alternatively, however, you can read files directly from the Internet.
- exports: Here are all files that you have generated yourself in the course of your work with the Jupyter notebook, e.g. tables (.csv) or graphics (.png).
3. ipynb - contains all Jupyter notebooks (.ipynb); all modified notebooks should also be stored in this folder.
Jupyter notebooks have the '.ipynb' file extension. They are usually assigned to the text editor. Unfortunately, some operating systems automatically change the extension to '.txt'. In this case please change it back to '.ipynb' - otherwise the Jupyter notebooks cannot be opened.
The tutorial Tutorial Jupyter Notebook explains how to load a Jupyter notebook tutorial.
Tutorial 1: Introduction and visualization of note texts
* Tutorial CAMAT_Basics_Part1_Introduction (Jupyter notebook; html-preview)
The scores to which musical analysis usually refers are, first of all, playing instructions for the musicians. Thus, it is a prescriptive notation. In contrast, musical structures are to be described in analysis as they sound. The American musicologist Charles Seeger has therefore distinguished from prescriptive notation the descriptive modes of notation, in which an attempt is made to graphically represent musical structures as they sound. The purpose of these visualizations is not to perform music, but to gain as good an impression as possible of its sounding structures.
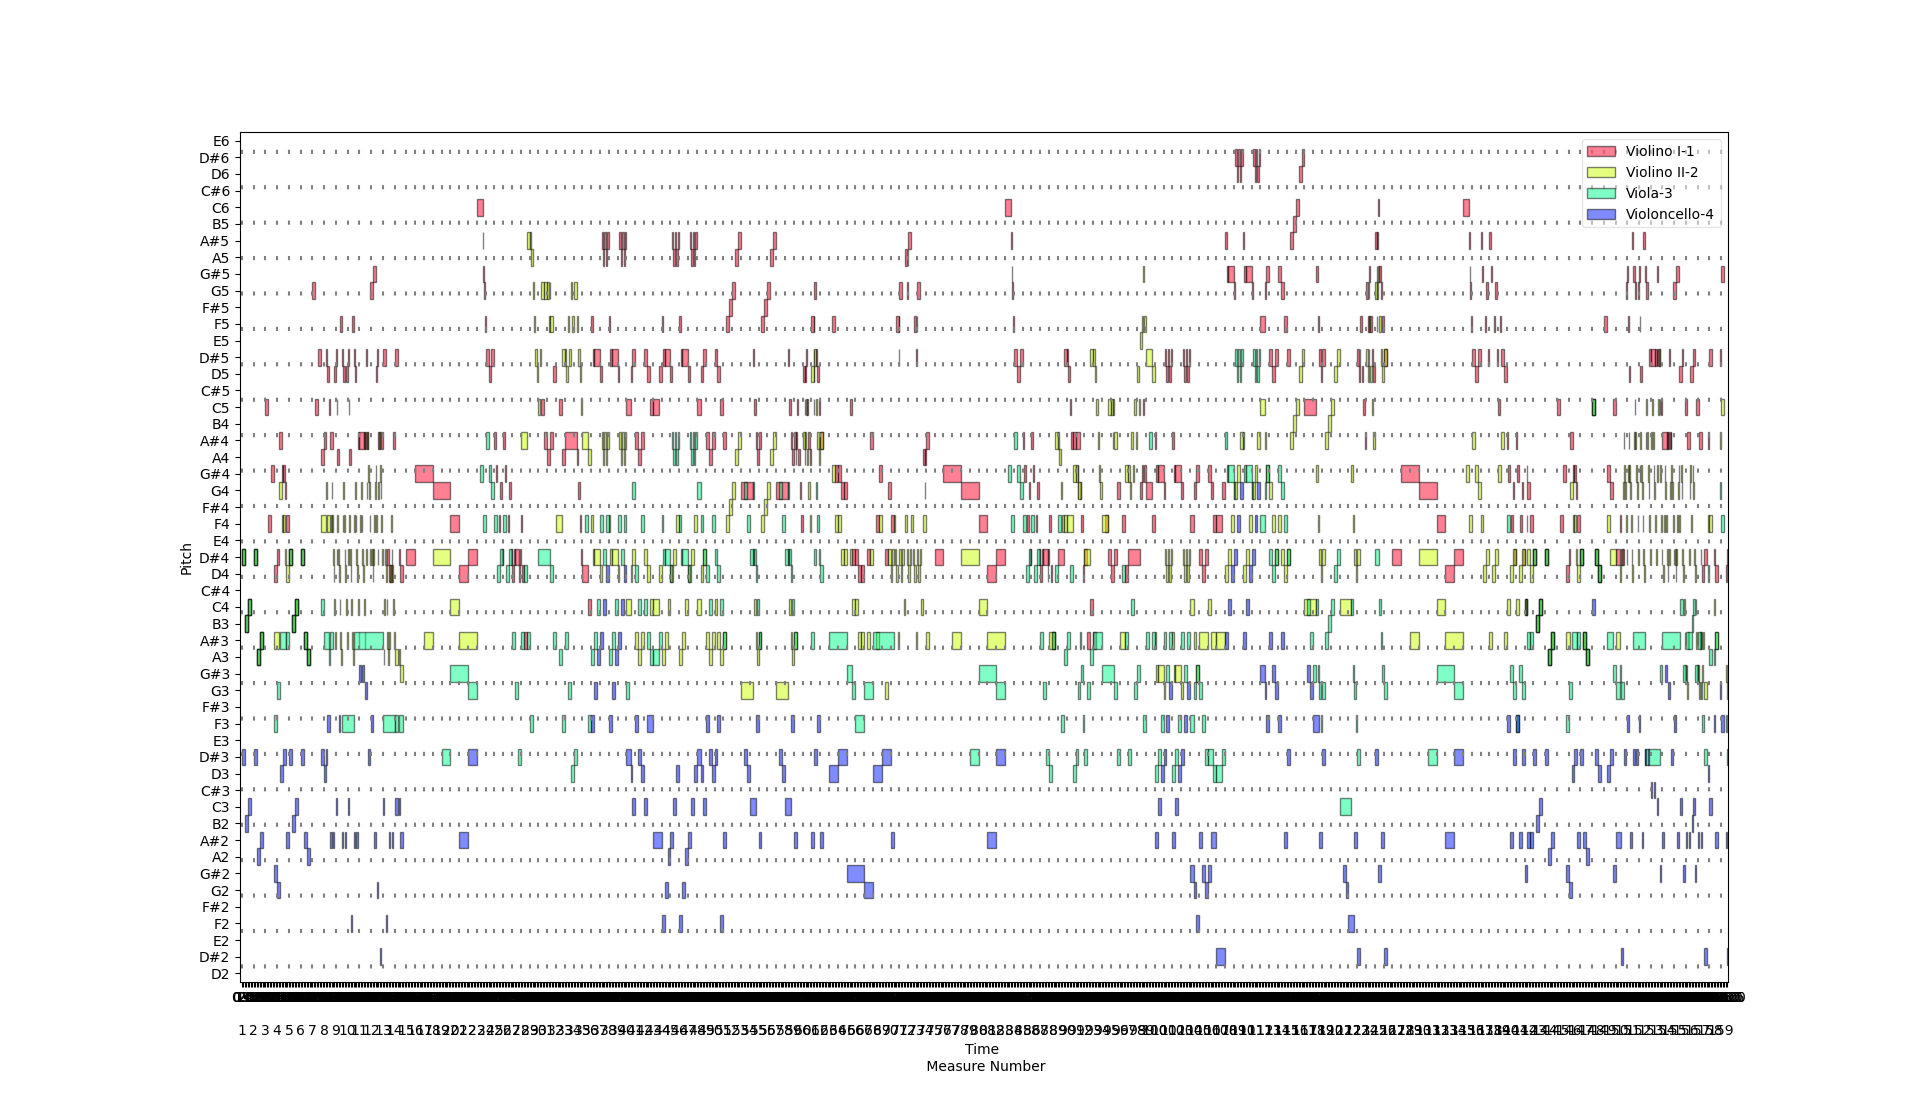
A simple descriptive notation is the two-dimensional arrangement of all played notes: the y-axis corresponds to the absolute pitch, the x-axis to the passage of time or the bars. This representation is called piano roll representation, because the rolls of mechanical pianos were also punched according to this pattern. In CAMAT, different instruments are represented with different colors (see legend at top right):
Here you can see a piano roll representation of the String Quartet No. 11 in E-flat major (Adagio), K. 171, by Wolfgang Amadeus Mozart:

Unfortunately, longer scores cannot be displayed completely as a piano rolls in the current version of CAMAT. However, you can display any desired sections.
Note: You can display piano rolls very clearly in the Sonic Visualiser and, at the same time, listen to them with MIDI sounds. A number of piano rolls are listed in the Subcorpus of the sheet music database and can be downloaded there (see last column Download). Detailed instructions on how to proceed and how you could generate piano rolls from sheet music files can be found here. |
Tutorial 2: Statistical queries of musical features
* Tutorial CAMAT_Basics_Part2_Statistics (Jupyter notebook; html-preview)
At first, the commands presented in the Jupyter notebooks can be used to query the number of notes (total or per voice), measures, and information about the ambitus (total and per voice).
By examining frequencies, a first overview of the simplicity and uniformity or the variety and complexity of a composition can be obtained. For example, is only the diatonic tone resources used in a composition, or are there also many chromatic tones? Do the individual voices progress mainly in small interval steps or are there (also) large leaps? Are there only few different note durations or a large variation of note values?
Answers to these questions are provided by frequency distributions in the form of histograms (= bar charts) and tables.With simple commands, the frequencies of the following parameters or variables of a score can be determined and displayed.
It is also possible to export the frequency distributions as so-called csv files („csv“ means: „comma-seperated values“). The csv format can be opened and read by spreadsheet software such as Excel, among others. In this way, the data can be processed externally, which may be necessary especially for corpus studies.
In addition, a convenient filter function can be used to select and evaluate individual bars or sections, or individual voices.
Pitch frequencies (Pitch) can be queried for the whole sheet music file and for each voice. A distinction is made between different octave positions. Here is the pitch distribution of the Mozart movement:
 C' = C1, C = C2, c = C3, c' = C4 ('middle c'), c'' = C5.
 (C4 corresponds to MIDI note 60, C5 = 72, etc.)
In CAMAT, the evaluation of pitches can also take into account the respective accidentals that are note down in the score (1 for #, 2 for ##, -1 for b, -2 for bb, 0 for the resolution sign).
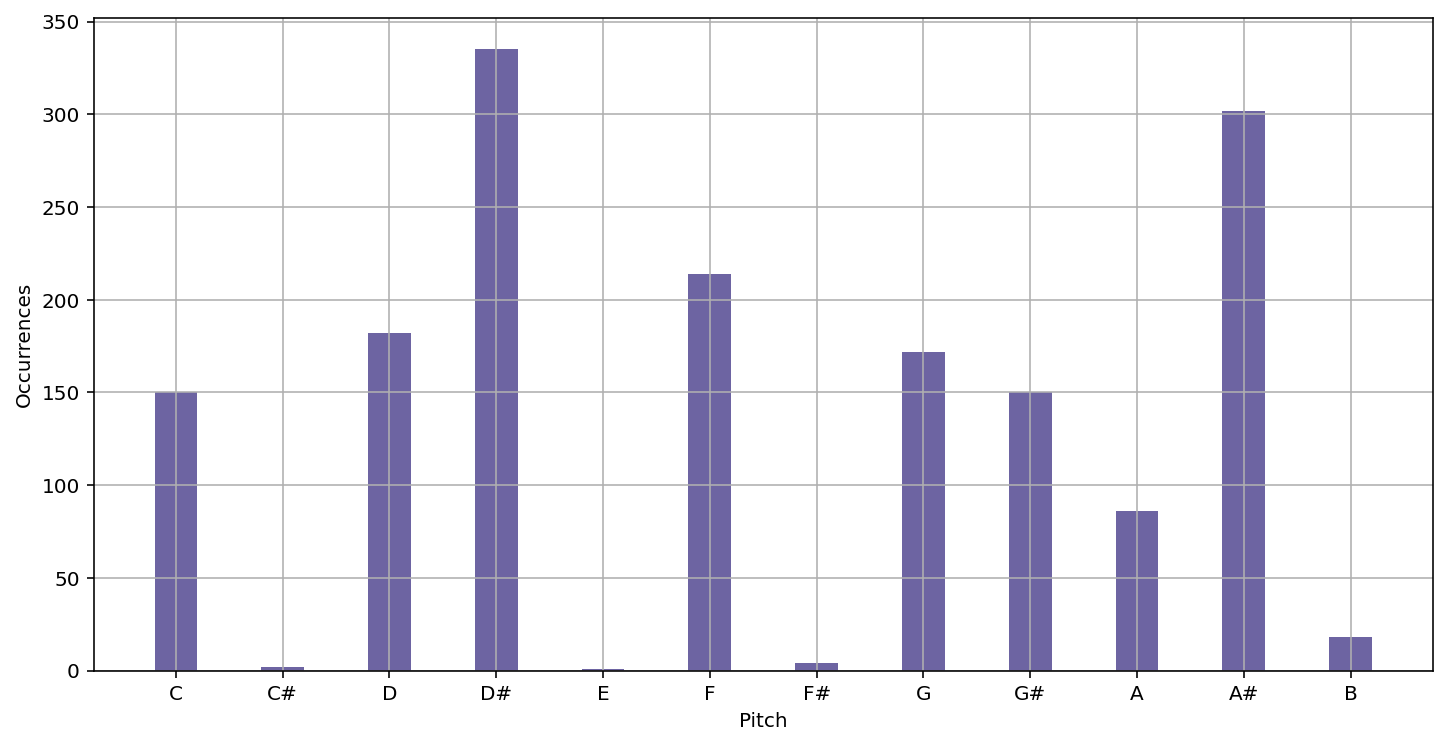
Frequencies of the twelve pitch classes (pitch classes) - per voice and in total. Here, no distinction is made between different octave positions or different accidentals!
The English pitch designations are used, with preference given to C# over Db and D# over Eb etc. Here are the pitch classes of the Mozart example:
 C C#(Db) D D#(Eb) E F F#(Gb) G G#(Ab) A A#(Bb) B C
 (B corresponds to the German H!)
Frequencies of interval steps or jumps in a voice.
Half steps upwards or downwards are determined. This is only possible for single voices and only with monophonic voice progression!
Here are the interval steps from the Mozart string quartet:
 The interval steps are counted down or up in semitone steps.
 (Ex.: -12 = octave step down.)
Frequencies of note durations / note values.
Note values are counted as multiples or parts of a quarter note:
 quarter note = 1
 eighth note = 0.5
 16th note = 0.25
 half note = 2
 etc.
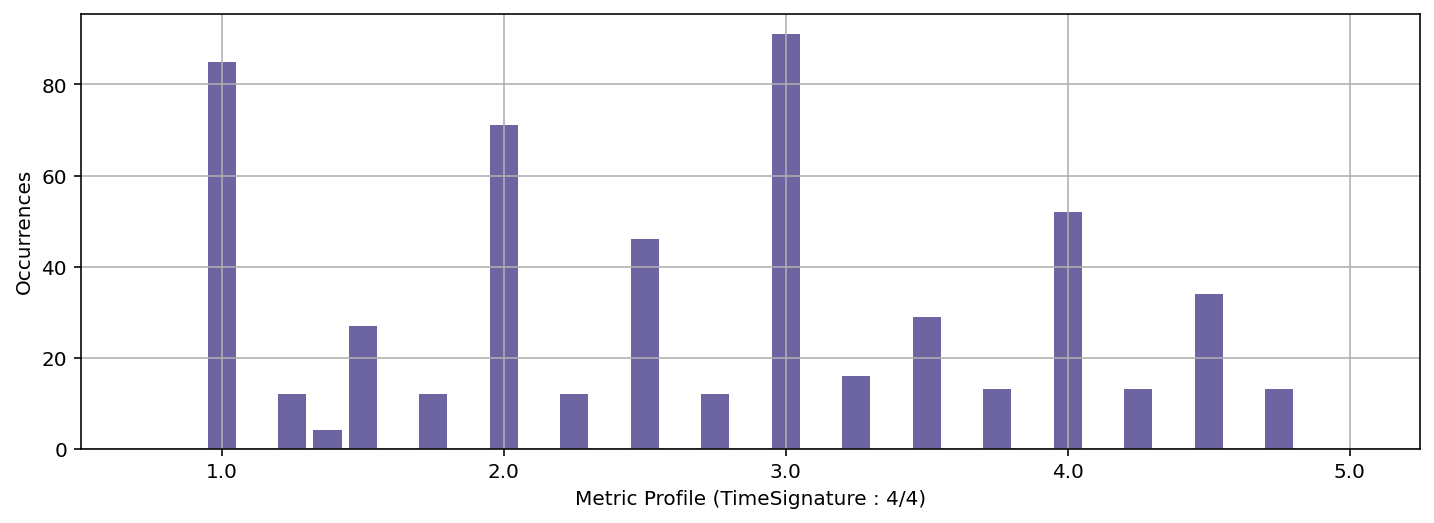
Metric profile
In a metric profile, all the notes that sound at a particular metric position are added up. This results in a profile of the frequencies of tone onsets on metric positions. It can be read from this, for example, to what extent the beat or certain metric positions (beginning of measure, middle of measure) are emphasized in a piece (or in a voice) or whether, conversely, a rather „floating“ meter is created by many notes between the main metric positions.
Two-dimensional frequency distributions.
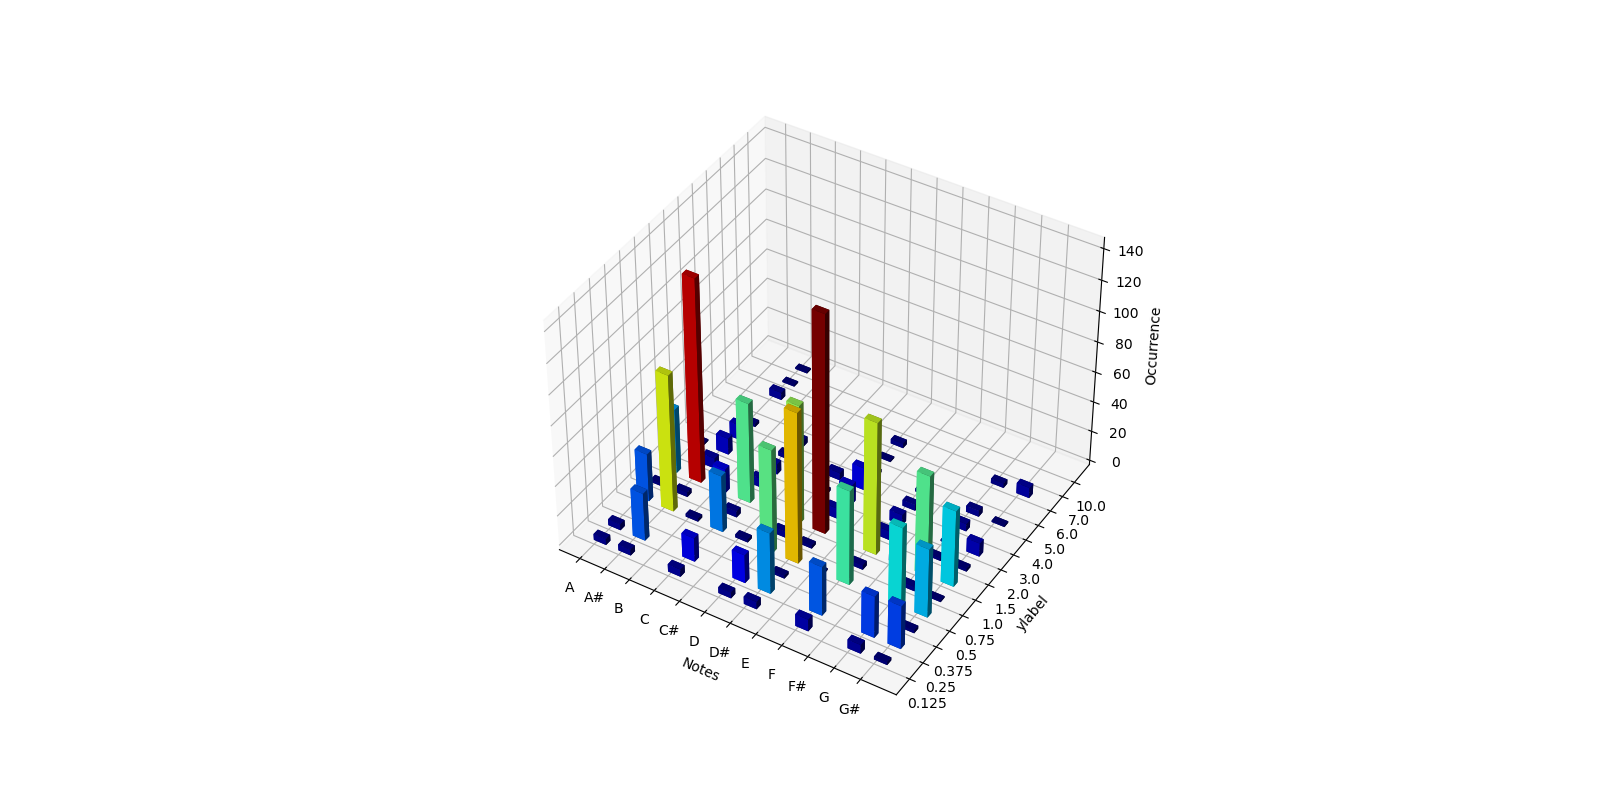
In addition, two of the mentioned musical parameters can be represented in so-called two-dimensional frequency distributions, i.e. in dependence on each other, e.g. the frequencies of the individual pitches coupled in each case with certain duration values (quarter, eighth etc.). The two-dimensional frequency distributions can be displayed as scatterplots or 3D plots. The following parameters can be related to each other:
- Frequency of note duration values related to pitch classes or pitches.
- Frequency of metric positions or metric weight related to pitch classes or pitches.
Here is an example: The frequency distribution of note durations related to pitch classes, displayed as a 3D plot. Here, the length and color (from blue to red) of the columns correspond to the frequency of a given combination of note duration and pitch class.

All statistical queries are initially applied to single sheet music files. A comparative evaluation between several movements and sections of a composition as well as several compositions is offered by the module advanced: Sheet Music Analysis with CAMAT.


