Inhaltsverzeichnis
Module Basics Audio
The module Basics Audio is dedicated to ways of visualizing music recordings using spectrograms. How do I create a meaningful spectrogram? What information can I draw from this visualization about the tonal, melodic and rhythmic design of the recording? The Tutorial Spectral Representations offers a practical introduction to this using a music example and the free software Sonic Visualiser. The second Tutorial Spectral Representation of Vocal Recordings follows up on that.
Spectral representations are not able to reconstruct or explain individual listening experiences. They can, however, illustrate these experiences and thus support their verbal communication. It is an approach via the acoustic properties of sound, which are collected metrologically. This approach can complement a culturally oriented approach to analysis and interpretation of music by providing rich information about the concrete sonic design of musical sounds.
The following introduction provides some basic information about digital audio files and spectral representations.
Basics: Digitizing Music Recordings
During the digitization (analog-to-digital conversion) of music recordings, the course of the acoustic signal is measured in regular time intervals (sampling periods). The number of samples per second is called (sampling rate) or sampling frequency fs . The frequency fs/2 (Nyquist frequency) is the upper limit of the representable frequency range; higher frequencies „fall through the cracks“ of the sampling frequency.
The common sampling frequency for audio files is 44,100 samples per second, i.e., 44,100 numerical values per second. (The choice of this sampling frequency was related to film technology; fortunately, however, it is greater than twice the upper human hearing limit of about 20,000 Hz.) The time series of these numerical values are the basis for digital signal processing of audio data, i.e. of all algorithms that extract certain information from audio data (cf. the module Advanced Audio). It does not matter in which audio format the audio data is available; the most common formats are the uncompromised wav format and the compressed mp3 format.
Various audio editors (e.g. Audacity) and other audio software offer possibilities to load, visualize and edit the audio data.
Waveform and spectrum
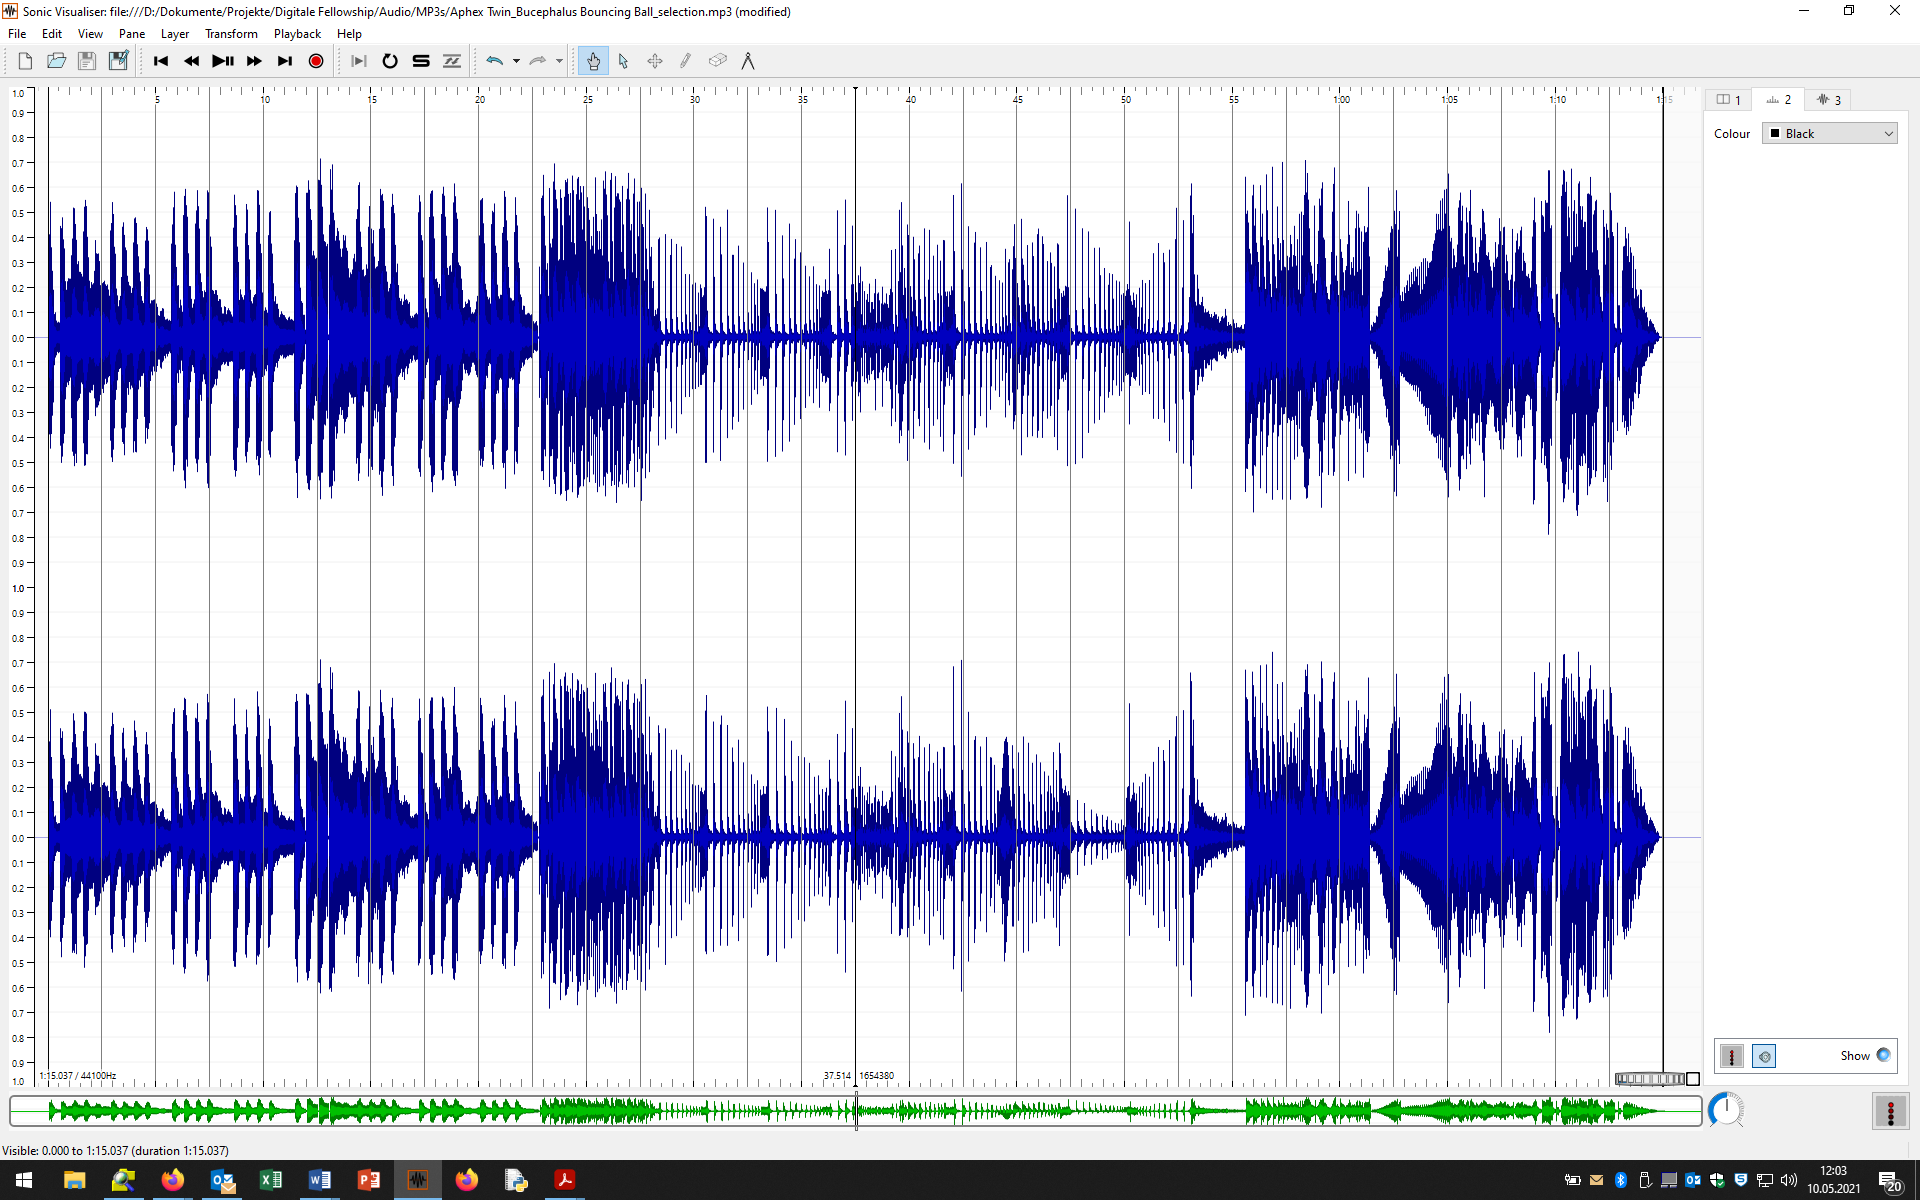
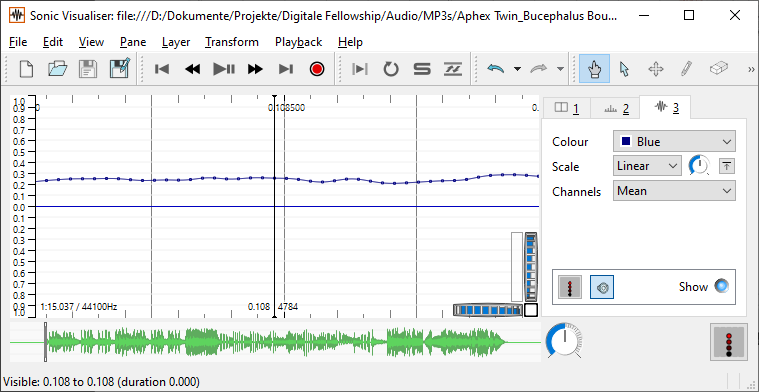
Fundamental is the waveform representation (see figure on the left) in which the values of the samples are displayed over time. If you zoom into a waveform far enough, the individual samples become visible (see figure on the right). Both figures were made with the Software Sonic Visualiser.
By means of a complex calculation method, the so-called Fourier transform (DFT = discrete Fourier transform, STFT = discrete short-time Fourier transform, FFT = fast Fourier transform), the strength or energy of the individual frequency components of an audio signal can be calculated and displayed as a spectrum. A spectrum is a snapshot of the sound related to a usually very short analysis window. For example, the analysis window in the following illustration is only 4096 samples, i.e. 93 milliseconds long (4096 : 44100 Hz = 0.093 s; Hertz is the reciprocal of Second; because frequency means number per second).
Depending on the size of the analysis window, a spectrum of varying accuracy is calculated, which can be useful for stationary sounds (which do not change much or at all over time). Changes of the sound or frequency spectrum in time, as they are normal in music recordings, on the other hand, are only visible in a so-called spectrogram.
Spectrogram
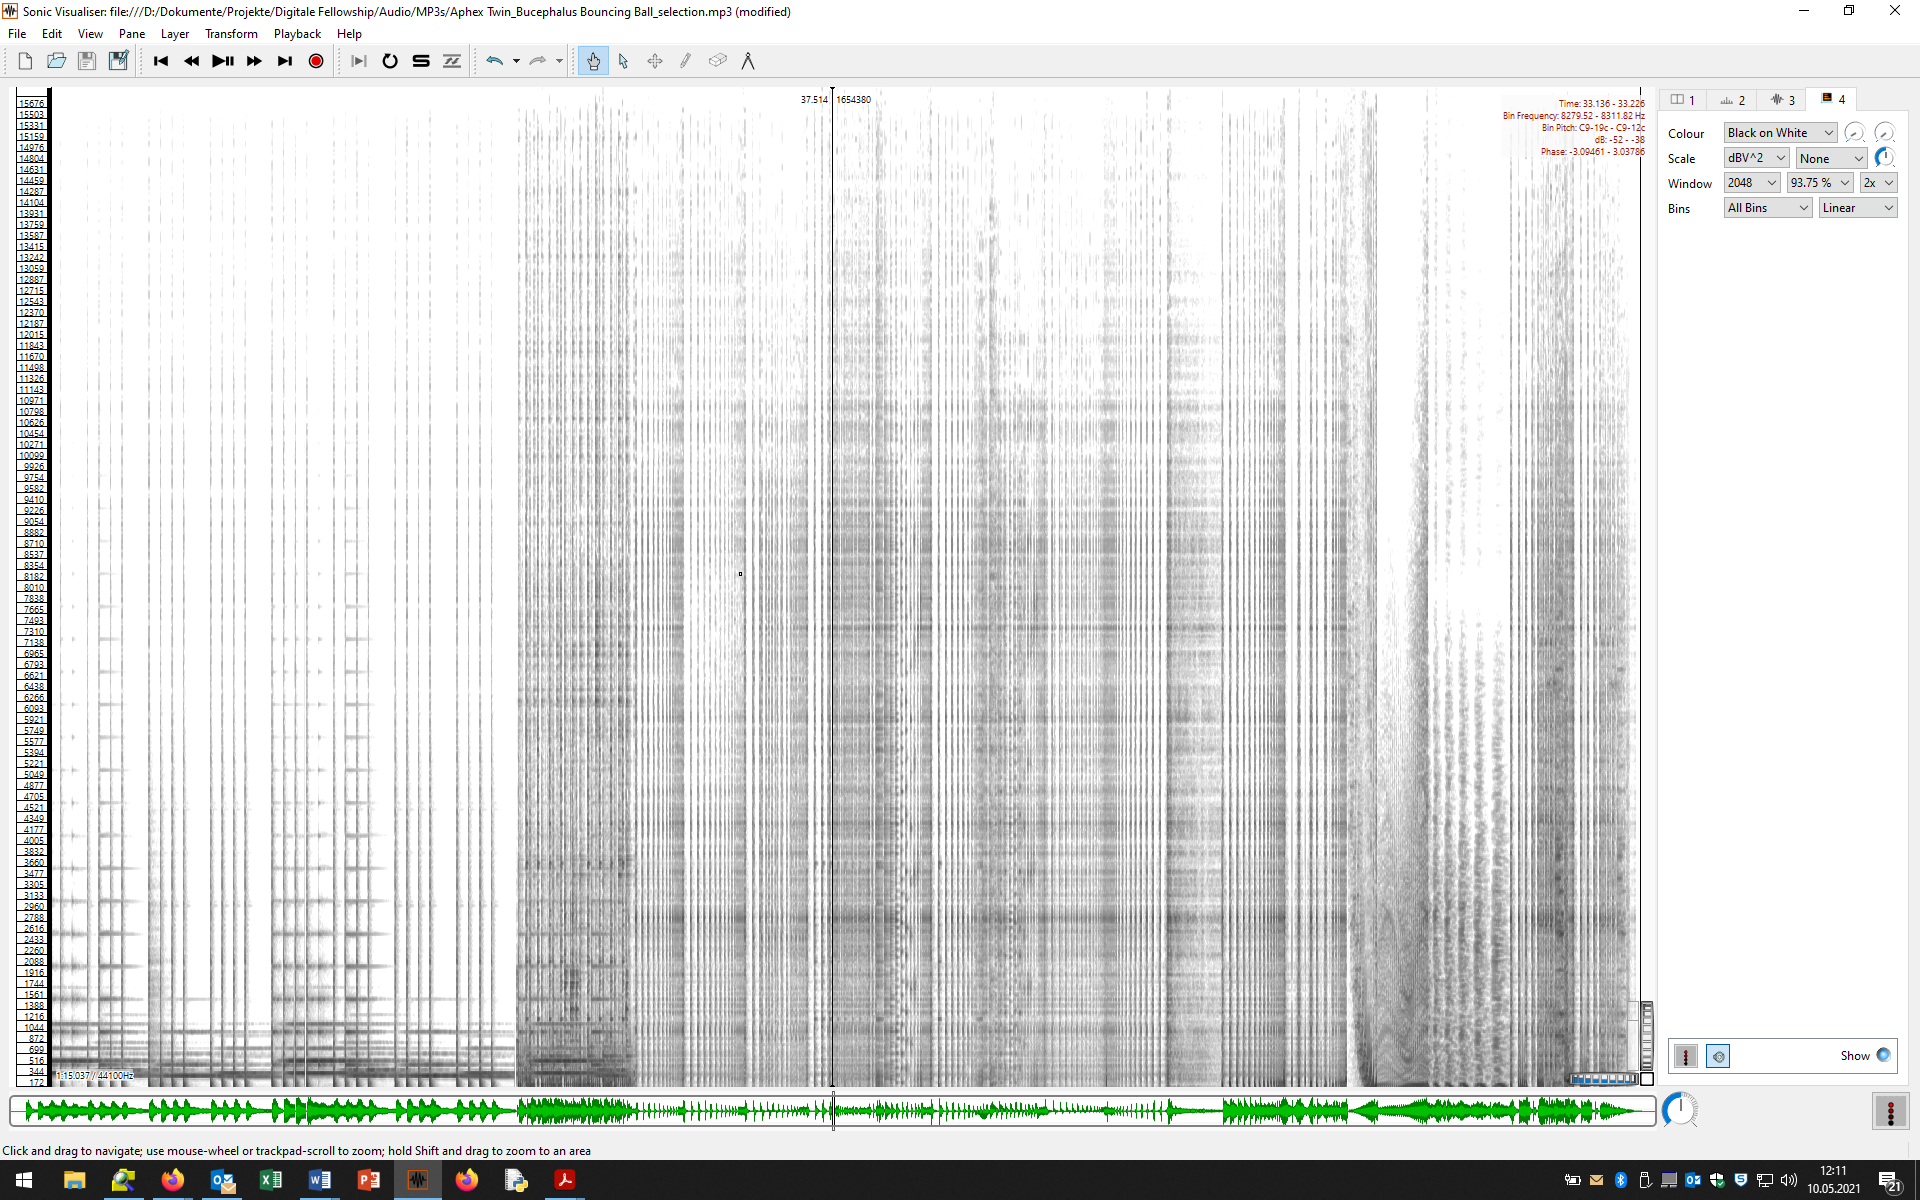
In a spectrogram, * the temporal course of a sound (horizontal axis) is related to * its frequency distribution (vertical axis) as well as * the relative strength of the individual frequencies (gray or color levels). In this process, countless Fourier transforms are performed for successive audio sections (analysis windows) and these spectra are „glued“ together. Here is the spectrogram of a recording we use in the Tutorial: Spectral Representations.
Basic rules for the interpretation of spectrograms:
- Parallel horizontal lines represent sounds of fixed pitch, with the lowest line representing the fundamental and the higher notes representing the various partials. The more and the higher partials a sound has, the brighter it sounds.
- Vertical lines stand for noise-like, percussive sounds, e.g. drum sounds, because the sound spectrum of noises or noise-like impulses usually extends over a very wide frequency range.
- Gray clouds in the spectrogram represent noise, e.g. sibilants in vocals or a fading cymbal hit.
When interpreting spectrograms, the peculiarities of human sound perception must always be taken into account. For not everything seen on a spectrogram has a correlate in auditory perception. The following rules of perceptual fusion of auditory events and perceptual integration of auditory streams are important:
- Frequency components that begin (approximately) at the same time and are in an integer relationship to each other are not perceived as distinct sound events, but are fused into a single sound event (event fusion). So we see several lines in the spectrogram, but hear only one sound.
- Sound events that have similar sound properties (e.g. a similar overtone structure) and are close to each other in terms of pitch and/or temporal sequence are assigned to one and the same sound source and thus to one sound stream (musically: a voice, an instrument) (auditory stream integration, Gestalt principles of similarity and proximity).
How you can create a spectrogram in the Sonic Visualiser and how a spectrogram can be interpreted, you will learn in the Tutorial: Spectral Representations. On the one hand, this is about finding an appropriate visualization for what you hear. On the other hand, you can sometimes recognize details in the visualization of a spectrogram that can open up your ears to new and previously unperceived things.
Deepening
If you want to learn more about spectral representations and their acoustic foundations, please consult one of the following introductions:
Stephen McAdams, Philippe Depalle, and Eric Clarke, „Analyzing Musical Sound,“ in Empirical Musicology. Aims, Methods, Prospects, ed. by Eric Clarke and Nicholas Cook, Oxford 2004, pp. 157-196.
Donald E. Hall: Musical Acoustics, 3rd edition, 2001.
Meinard Müller: Fundamental Music Processing. Audio, Analysis, Algorithms, Applications, New York 2015. In it: Chapter 2: Fourier Analysis of Signals, available online in the FMP Notebooks (with Jupyter notebooks for reprogramming!).
Interesting research results and audio examples on auditory perception and the so-called Auditory Scene Analysis can be found on the website of Albert S. Bregman.


![[example from Sonic Visualiser] [example from Sonic Visualiser]](/lib/exe/fetch.php?w=400&tok=67086a&media=audio01_screenshot04.png)
