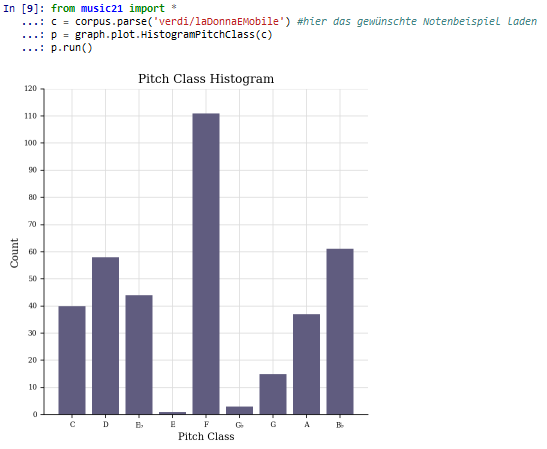
Um ein Pitch-Class-Histogramm zu erzeugen kann die music21 Modul music21.graph.plot.HistogramPitchClass verwendet werden:
from music21 import *
c = corpus.parse('verdi/laDonnaEMobile') #hier das gewünschte Notenbeispiel laden
p = graph.plot.HistogramPitchClass(c)
p.run()
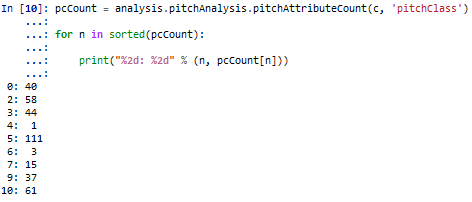
Die einzelnen Werte können durch music21.analysis.pitchAnalysis Modul als Tabelle angezeigt werden:
pcCount = analysis.pitchAnalysis.pitchAttributeCount(c, 'pitchClass')

for n in sorted(pcCount):

    print("%2d: %2d" % (n, pcCount[n]))
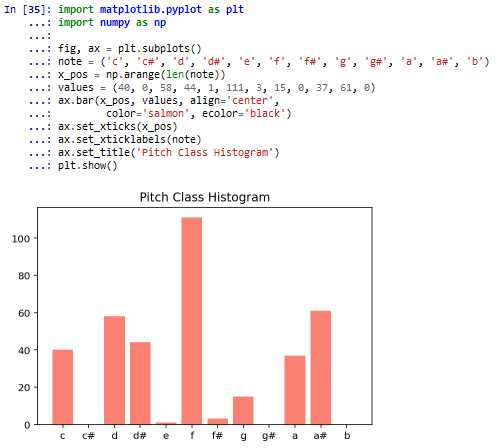
Ebenfalls kann die Histogramm-Visualisierung durch Matplotlib und NumPy realisiert werden:
import matplotlib.pyplot as plt
import numpy as np

fig, ax = plt.subplots()
note = ('c', 'c#', 'd', 'd#', 'e', 'f', 'f#', 'g', 'g#', 'a', 'a#', 'b')
x_pos = np.arange(len(note))
values = (40, 0, 58, 44, 1, 111, 3, 15, 0, 37, 61, 0)
ax.bar(x_pos, values, align='center',
        color='salmon', ecolor='black')
ax.set_xticks(x_pos)
ax.set_xticklabels(note)
ax.set_title('Pitch Class Histogram')
plt.show()


